USAA

Above: Using Illustrator, I created a scale to convey complexity of an effort, versus the severity of the problem. I documented over 30+ infractions of heuristic principles throughout the software tool. I created a key or legend using color and numbers that conveyed what sections the infraction occurred, and how severe the infraction is that requires attention.
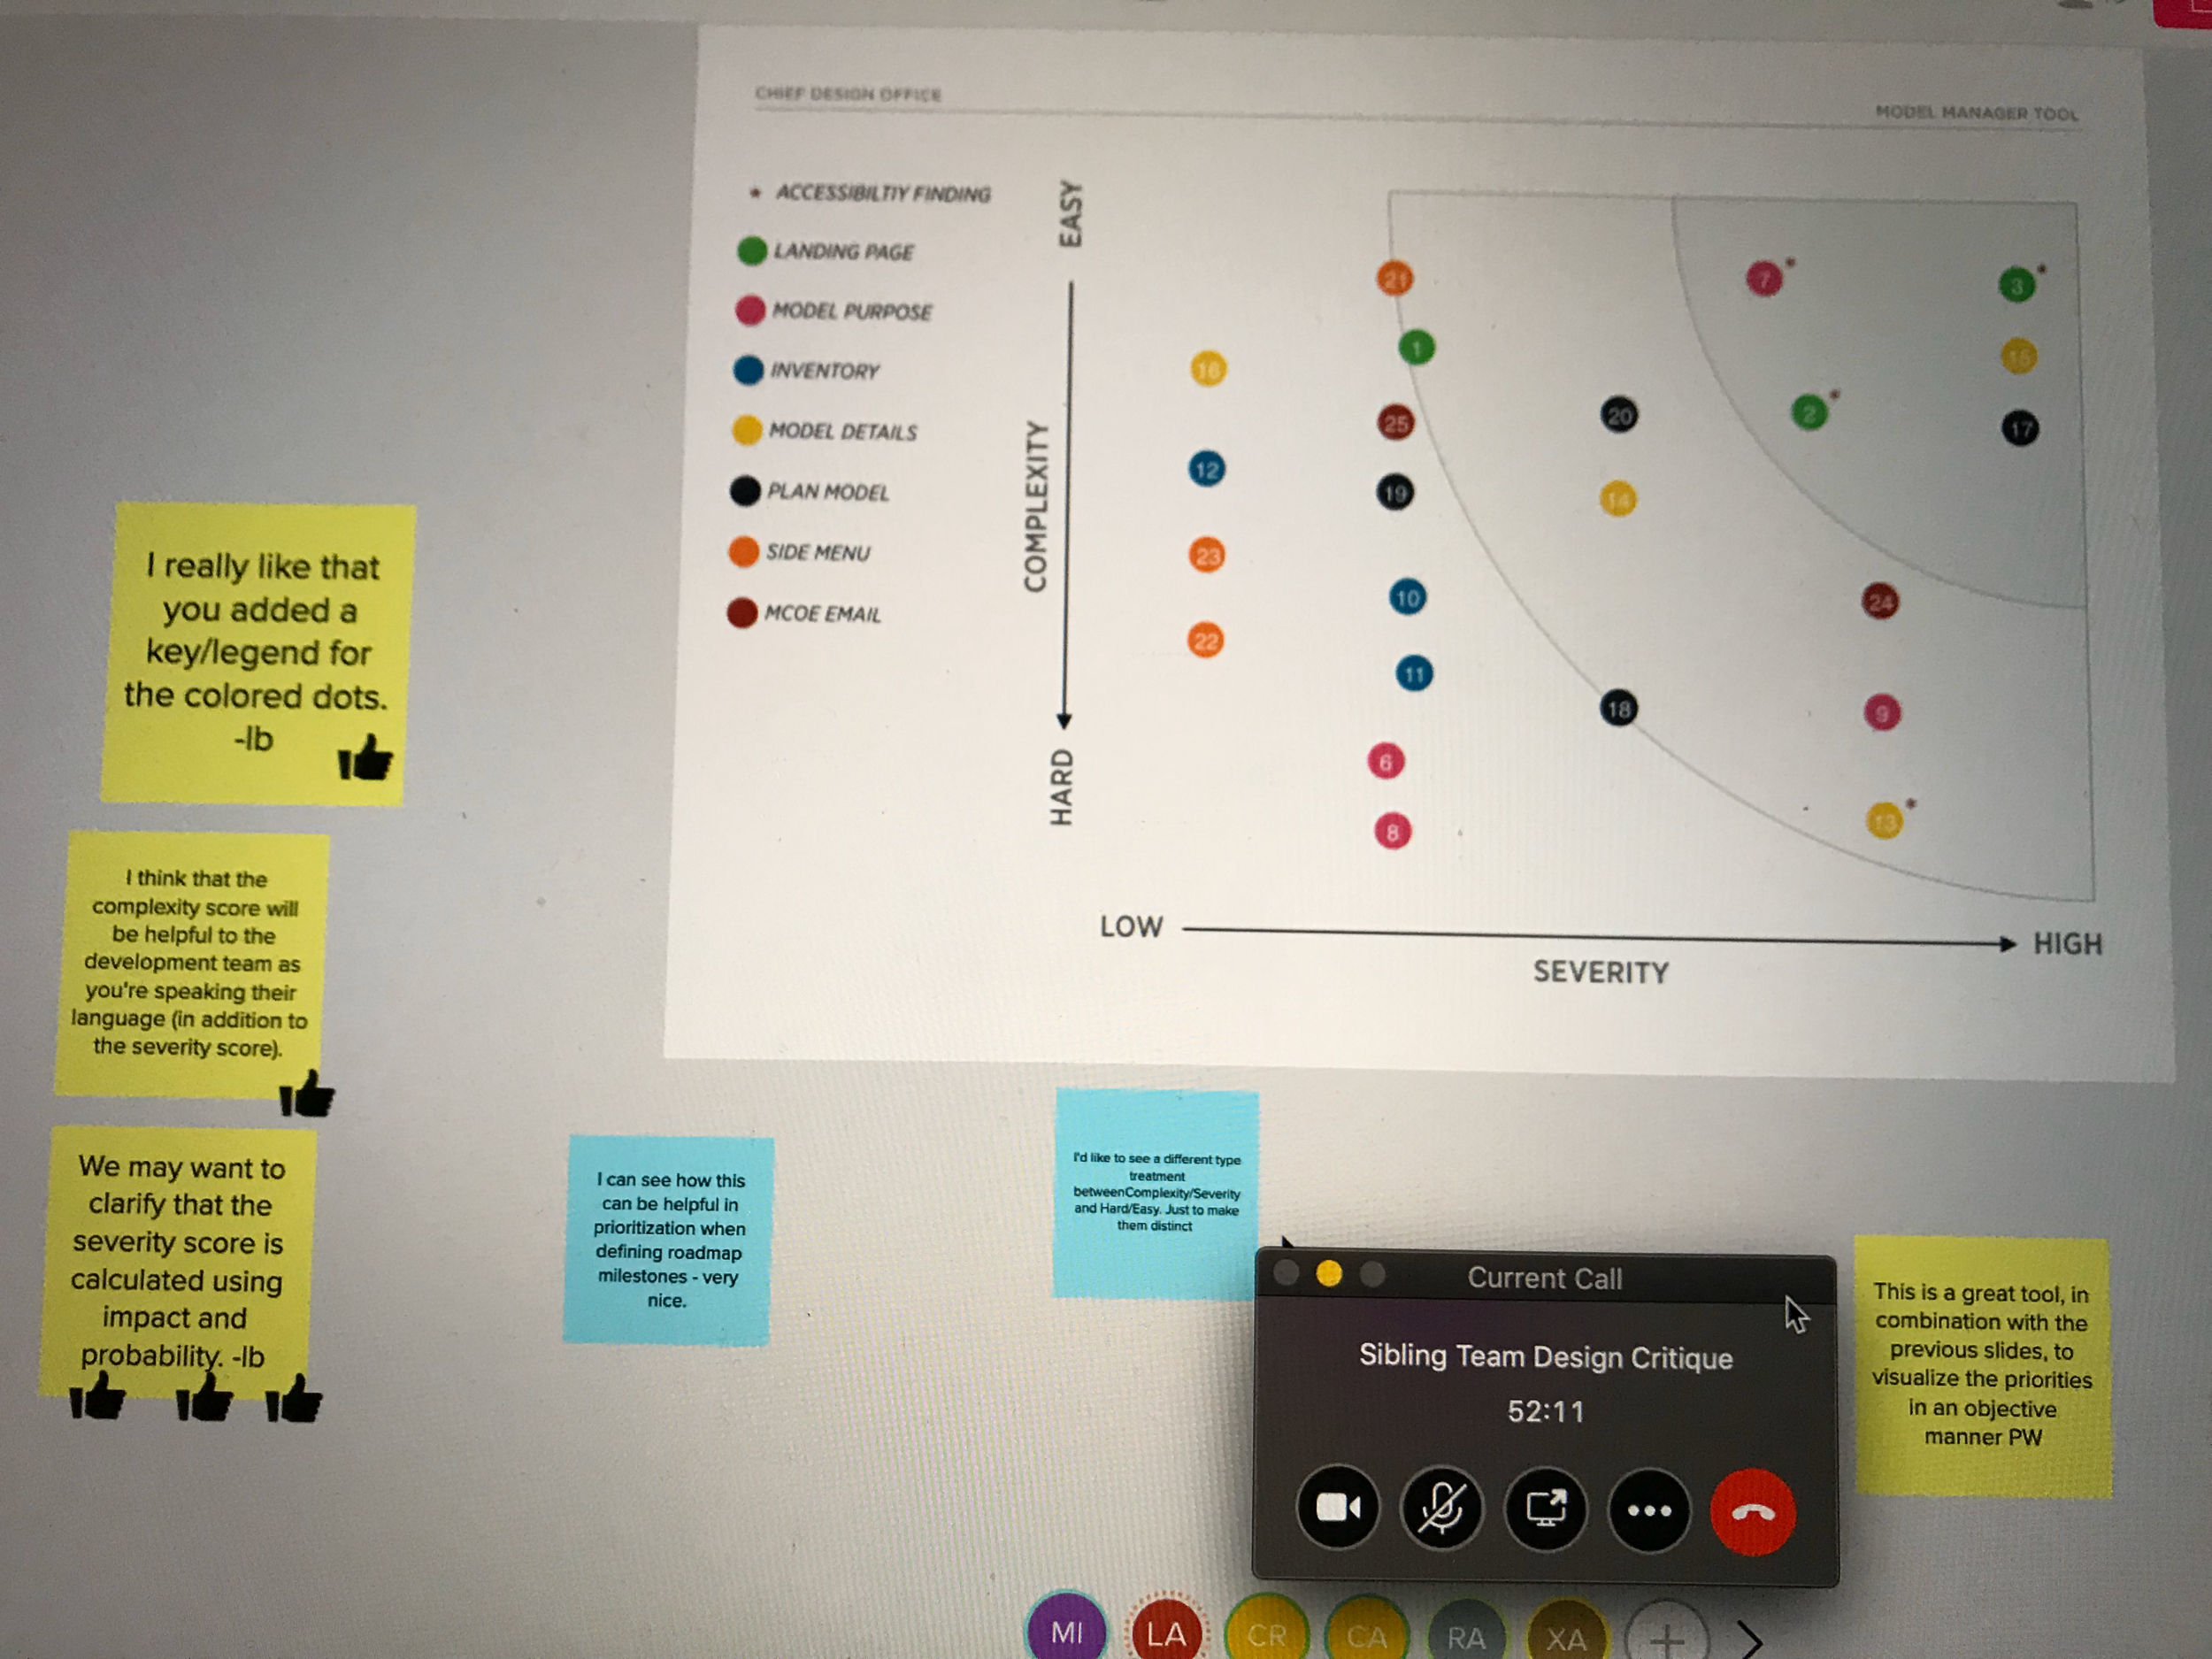
Above: After creating the diagram, I imported the visual into Mural so that team members can provide input and feedback. It is important to submit work for team critique to provide the best possible solution for the stakeholders.
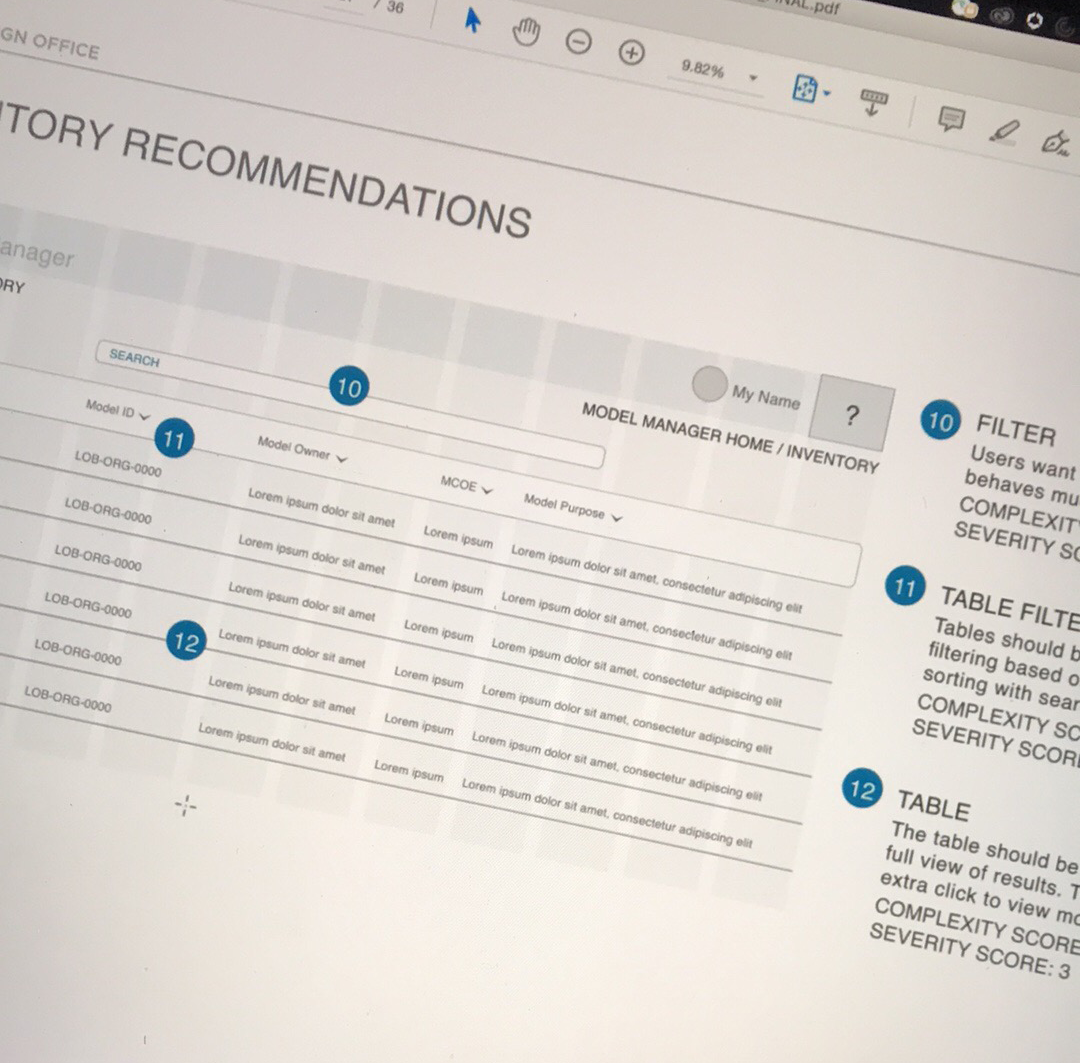
Above: To help developers and stakeholder better identify exactly where the infraction occurred, I created a simple wireframe for each page we could identify within the software and labeled each page with corresponding numbers. This way they can associate the color and number to the Impact and Effort Scale.
Measuring Impact and Effort
I was tasked with working on a team redesigning a proprietary enterprise solution used for access management. The experience in place was not compliant by accessibility standards, and there was a difficulty in using the tool, so training someone to use this portal required an investment of someone’s time.
I evaluated the tool and focused specifically on heuristic principles that could improve the usability of this tool. The Nielsen Norman Group 10 Usability Heuristics for User Interface Design is a great resource for identifying areas of improvement. More importantly, it minimizes the level of friction between a development team that might push back on design feedback when the UX Designer can provide documentation for best practices.
Presentation
Once the findings have been gathered we calculated each heuristic infraction by applying a severity score to each. There were seven overarching areas of concern and we associated those areas with corresponding colors. We then applied a number to each heuristic infraction that overlaid with a corresponding color. This made it easier to identify specifically where the problem was, and how severe the issue was on the spectrum.
Upon completion our team double checked each other’s work and we compiled a presentation deck of 30+ pages that explained our objectives, our findings, and our recommendations.